

In late August, Statistics Canada released several updates to its ongoing “Quality of Employment in Canada” publication. These data drops include articles related to average wages, workers earning low pay and training participation, along with material covering perceived job security, paid leave entitlement, and medical and dental benefits coverage.
The statistical agency’s frequent updates in this series provide timely and broad snapshots of job quality in Canada. As the latest figures indicate, workers have made some gains in the post-pandemic economy, but longstanding inequalities persist.
The “Quality of Employment” series tracks data across seven separate dimensions: “safety and ethics of employment”; “income and benefits from employment”; “working time and work-life balance”; “security of employment and social protection”; “social dialogue”; “skills development and training”; and “employment-related relationships and work motivation.”
Pay is, understandably, perhaps the most important indicator of job quality. According to StatCan, average hourly wages for all employees 15 years and older reached $35.20 per hour in 2024. Adjusting for inflation, average hourly wages increased by $1.69 per hour, or 5 per cent, from 2019, and by $5.47, or 18.4 per cent, from 2006, the year the agency started collecting comparable data.
It’s important to keep in mind that the composition of jobs affects average hourly wages. For example, during the COVID-19 pandemic, low-wage workers were much more likely to lose their jobs. This had the effect of raising average hourly wages markedly, as unemployed low-wage workers were eliminated from the sample. During the first year of the pandemic, average hourly wages grew by 5.3 per cent, for instance. As health restrictions eased, low-wage jobs grew again, bringing down recorded wage growth.
The post-pandemic inflation also put considerable pressure on workers’ earnings. In 2022, inflation reached a 40-year high of 6.8 per cent, with notable increases for the prices of energy (22.5 per cent), transportation (10.6 per cent) and food (8.9 per cent). According to the Bank of Canada’s inflation calculator, overall prices increased by 18.3 per cent between 2019 and 2024.
Despite general growth in inflation-adjusted wages, significant inequalities among workers persist. For example, wages remain lower among women, younger employees, Indigenous people and for several racialized groups.
In the case of women, the gender wage gap continues. Since 2006, the average wages of women have grown faster than men: 21.3 per cent compared to 15.9 per cent. Yet, in 2024, men continued to earn 12.6 per cent more than women on an hourly basis (down from 16.5 per cent in 2006).
A similar dynamic is observable when comparing workers in the private and public sectors. Over the past two decades, hourly pay among private sector workers has grown considerably faster than it has for public sector workers. Since 2006, inflation-adjusted, average hourly wages for private sector workers has jumped by 22 per cent, compared with only 7.6 per cent for those working in the public sector. Despite these disparate growth rates, however, public sector employees continued to earn more: $40.83 per hour vs. $33.35 per hour, on average.
Racialized wage gaps also remain entrenched, though less so. Among workers between 25 and 54 years of age in 2024, First Nations living off-reserve, Métis living in the provinces, and Inuit living in the provinces, all had average hourly wages below their non-Indigenous counterparts. In 2024, the wage gap with non-Indigenous employees was 11.6 per cent for First Nations workers living off-reserve, 5.6 per cent for Métis workers living in the provinces and 11.5 per cent for Inuit employees living in the provinces.
South Asian, Arab, Southeast Asian, Latin American, Black and Filipino workers all had lower average hourly wages than those of non-racialized, non-Indigenous workers in 2024, with the latter two groups of workers falling the furthest behind (-22.2 per cent and -25.9 per cent, respectively).
As StatCan reports, the share of workers in Canada earning low pay has declined from 24.2 per cent in 2006 to 18.5 per cent in 2024. The statistical agency defines low pay as earning less than $20 per hour in constant 2024 dollars. The largest decreases in workers earning low pay occurred between 2009 and 2013 and 2019 and 2022.
While an improvement, Canada still stands out as a country with a comparatively high share of workers earning low pay. In 2023, the Organisation for Economic Co-operation and Development (OECD) average was 12.7 per cent of workers earning low pay.
The gender gap in low pay is similar to that observed for average wages. While the share of women earning low pay has shrunk faster than men (down by 7.9 percentage points compared to 3.4 percentage points), women remain more likely to be earning low pay. In 2024, 21.8 per cent of women earned low pay, compared to 15.4 per cent of men.
Earning low pay is also highly racialized in Canada. All racialized groups are more likely to earn low pay than their non-racialized counterparts, while nearly three in 10 recent immigrants were also earning below the low-pay threshold in 2024.
In addition, workers with low pay remain highly concentrated in particular sectors — accommodation and food services and retail trade, in particular. About 62 per cent of workers in the former industry earned low pay in 2024, as did 52.1 per cent of workers in the latter.
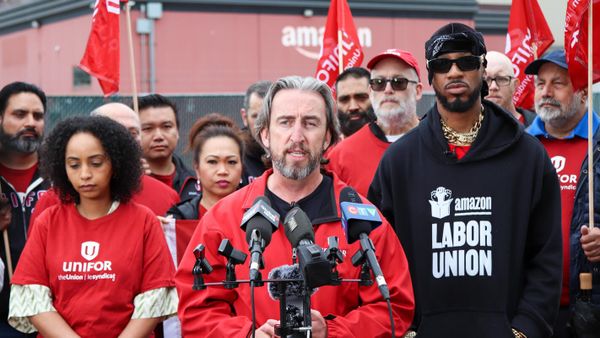
If Canada is to ever solve its persistent low pay and earnings inequality issues, it will have to address its extremely low private sector union coverage. The reason that such a small share of workers in the Nordic countries earn low pay — in 2021 in Norway, Finland and Denmark, the rates were just 7.4, 8.4 and 9.5 per cent of workers, respectively — is because sectoral bargaining agreements set wages for entire industries. This model takes wages out of competition, raises pay for workers at the bottom of the distribution, compresses pay scales and gives the vast majority of workers union-negotiated wages.
When it comes to perceived job security, StatCan’s recent findings are mixed. On the one hand, only 7.7 per cent of employees agreed or strongly agreed that they might lose their jobs in the next six months. This is a significant decrease from the rate of 10.8 per cent in the fall of 2016.
On the other hand, a higher proportion of workers neither agreed nor disagreed that they might lose their job in the next six months (18.4 per cent) compared with November 2023 (14.2 per cent) and the fall of 2016 (13.5 per cent). This suggests that while the trade war with the United States has introduced uncertainty into the Canadian economy, it hasn’t necessarily convinced more workers that their jobs are under immediate threat.
At the same time, the form of employment workers have influenced perceived job security. In April 2025, 22.8 per cent of temporary employees agreed they might lose their job in the next six months, compared with only 5.8 per cent of permanent employees. Among the different types of temporary employment, casual workers had lower rates of perceived job insecurity than those with term, contract and temporary jobs, and those with seasonal jobs (14.3 per cent, 26 per cent, and 24.8 per cent, respectively). Similarly, nearly 11 per cent of part-timers agreed or strongly agreed they may lose their jobs in the next six months.
Figures on access to paid leave entitlements tell a similar story of recent improvements alongside persistent inequalities. In 2024, 72.9 per cent of workers reported entitlement to paid vacation. This is up from 70.3 per cent of employees in 2021, with permanent employees and those working in the public sector much more likely to report having access to paid vacation. Because all Canadian jurisdictions guarantee at least two weeks of paid vacation to all employees after a specified tenure of employment, workers who lack access are typically those with short job tenure who have yet to qualify. However, had the survey tracked paid leave entitlement beyond the statutory minimum, it would likely be a much different story.
Medical and dental benefit coverage is comparable. In 2024, 66.8 per cent of employees reported that they had workplace medical or dental benefits in their main job, a proportion that has grown from 63.3 per cent in 2021. At the same time, women’s concentration in part-time work renders them less likely than men to have medical and dental benefits (63.8 per cent of women, compared with 69.5 per cent of men). Those in temporary jobs are also about half as likely to have these benefits. Unsurprisingly, being unionized, working in the public sector and having a permanent full-time job were the strongest predictors of benefits coverage.
All of these figures tell us a similar story. Over the past two decades — and particularly since the COVID-19 pandemic — the quality of employment in Canada has improved along several important indicators, if only marginally on some. Yet, inequalities of gender, race, employment type, immigration status and age continue to hold workers back.
This matters not only because such a situation is inequitable, but also because these inequalities divide workers and impede the kind of class solidarity that is necessary to pull everyone up.
Fundamentally, addressing poor employment quality requires that more workers gain greater access to collective bargaining. So long as only 15 per cent of workers in the private sector have a union, we should expect such inequalities to persist.
Recent Class Struggle Issues
- November 3 | Alberta Forcing Teachers Back To Work Is A Historic Loss
- October 27 | CIRB Rules Against Canada Post Union’s Back-To-Work Challenge
- October 20 | Capitalism And Colonialism: How Modern Canada Was Made
- October 13 | Charges For Workers’ Rights Violations Drop 90% In Ontario