
Are we in for a “summer of strikes” in 2023? Some academics and commentators think so. In fact, throughout this year, many have anticipated and, perhaps prematurely, celebrated an uptick in work stoppages.
Yet this was also the case last year, with some in the media predicting a “summer of labour unrest” as inflation spiked and union contracts that were extended during the pandemic expired. Without a doubt, high-profile strikes by public sector workers in British Columbia, Ontario and, this year, in the federal public service, certainly gave the impression that union militancy was back and workers were increasingly willing to walk out for better wages. In the private sector as well, strikes at the B.C. ports and at Windsor Salt — both of which saw workers vote to reject tentative agreements — have been noteworthy.
But there’s always been a slight problem with the “strike wave” narrative: the data on work stoppages don’t bear it out. Highly visible strikes — particularly when they manage to generate and sustain public support — are important for the labour movement and can encourage workers across the economy to demand more. But just because such actions are on the public radar doesn’t necessarily mean they are indicative of an appreciable growth in strike activity across the whole of the economy.
Strike Activity Nationally
“Work stoppages,” including both strikes and lockouts, are tracked by Employment and Social Development Canada. This national-level data is the primary source for gauging labour unrest on a yearly basis. As the first graph shows, over the last decade or so, there hasn’t been any noticeable increase in strike action. The year with the greatest number of work stoppages in the last decade was 2015. After that, things fell off somewhat, before rising again slightly post-pandemic. There were 181 stoppages in 2021 and 156 in 2022. In other words, in 2021 unions broke out of the downward trend in strike activity witnessed between 2016 and 2020, but haven’t managed to bring strikes back to their 2015 level.
At present, things don’t look poised for any appreciable change in 2023. We’re only halfway through the year, but if trends continue, we’re on track for around 130 work stoppages. In other words, strikes seem to again be trending down, not up, since 2021. Against a broader historical background, the entire past decade looks paltry, of course. Canadian unions struck hundreds of times per year in the late 1970s.

Measuring total work stoppages is important, but it can also be somewhat limited. Striking union locals vary in size and strikes continue for different lengths of time. Consequently, there are times when measuring the number of workers involved in strikes and the “person-days lost” (number of workers involved multiplied by the number of days on strike) can tell us more. But, based on these figures too, it’s difficult to argue we’re in the midst of a labour upsurge.

Again, 2015 was a pre-pandemic highwater mark for the number of workers involved in strikes, with ESDC recording nearly 429,000 on the picket line at some point during the year. In 2020, something relatively anomalous happened. Over 624,000 workers went on strike, even though only 57 total work stoppages took place. In short, several very large public sector walkouts involving bargaining units with many workers positively skewed the “workers involved” figure (more on this below). However, after 2020, the number of workers involved in strikes has, like work stoppages overall, trended downward. This year could see the number of workers involved in strikes split the difference between 2021 and 2022, if the first six month’s trend continues. We’ll see.
If the number of workers involved in strikes isn’t markedly higher, but “person-days lost” to strikes is up, this can only mean that the duration of work stoppages has increased. There is some evidence that this is the case. Generally, this is undesirable. Strike success and strike length tend to be negatively correlated. Between 2014 and June 2023, there was an annual average of 1,416,720 person-days lost to strikes. The spike around 2015 is expected given the large number of strikes that year. The slight upward trend since 2019 is somewhat worrying, by contrast. The figures suggest that employers and governments seem to be willing to hold the line against striking workers. In the first half of 2023, there has already been over 1.5 million person-days lost to strikes, across only 65 work stoppages.

A Closer Look At Ontario
While ESDC’s data is indispensable for a portrait of union activity in Canada as a whole, it does have some limitations due to sampling criteria (for example, it excludes some small strikes). We can fill in the gaps somewhat by looking more closely at Ontario, the province with the largest concentration of union members in English Canada. Ontario’s data collection infrastructure also makes it a lot easier to track union settlements, wages and strikes (of all sizes) in close to real time.

As the figure above indicates, there isn’t much sign of a strike wave in Canada’s largest province either. The standout year over the past decade was 2020, when rolling walkouts by teachers against the impacts of Ontario Premier Doug Ford government’s then-newly implemented Bill 124 registered a surge in strike activity. When this somewhat anomalous year is excluded from the count, the average number of strikes per year between 2013 and 2022 is the same as the number recorded in 2022: 35.
Looking at the number of workers involved in strikes in Ontario illustrates the point even more starkly. While the number fluctuates between a low of around 5,500 and a high of 120,000 for all years except 2020, in the latter year it shot up to 820,813. (Note that ESDC’s more limited sampling didn’t capture many of the smaller walkouts, so the recorded figure for Ontario is larger than the national figure.) In 2022, somewhat more workers were involved in strike action in Ontario, but it wasn’t exactly awe-inspiring.
Tracking strikes and the number of workers involved in them from year to year, while the standard practice, tends to miss one important piece of context: A lawful strike can only happen when a union is negotiating a new collective agreement and has met certain criteria, such as exhausting the bargaining process and conducting a strike vote.
The first thing to note is that, obviously, the number of unions negotiating new collective agreements — and therefore lawfully able to strike — varies considerably in any given year. In some senses then, what really matters for gauging the militancy of unions is tracking the share of collective bargaining negotiations that involve a strike. The national data on work stoppages don’t allow for this measure, but Ontario’s data do. As the next graph demonstrates, the percentage of bargaining rounds that involve a strike is normally very low, around 2 per cent per year. In other words, most unions secure new collective agreements without going on strike.

As above, 2020 is an outlier. Nearly half of new collective agreements ratified in that year involved a strike, but only because teachers’ unions engaged in many geographically-dispersed but short walkouts. However, 2021 to 2023 does show an increase in the share of new union contracts ratified after a strike, if only marginally. In 2021, 2.8 per cent of contracts involved a strike, up slightly from the pre-2020 norm. In 2022 though, nearly 23 per cent of union settlements followed workers going on strike. In the current year, between January and June, workers struck in just over 4 per cent of contract negotiations, nowhere near on par with last year but nevertheless above the roughly 2 per cent average of the pre-2020 years. If we’re looking for a measure that shows an increase in union militancy, this is likely it.
Yet, even this should be contextualized somewhat further. There is a tendency to think of union contracts as either secured “at the table,” for example through bargaining, or “on the picket line.” In fact, collective agreements can also involve unions and employers going through conciliation, mediation, and/or arbitration. Without going into detail, formality and government involvement tend to increase at each of these stages of outside intervention.
As the figure below shows, sizable shares of union contracts are typically arrived at through these forms of government involvement or imposition every year. In some cases, unions seek out conciliation or mediation when faced with an intransigent employer; in many other instances, however, state intervention is more of an imposition, particularly in the public sector.

Most notably, 2021 and 2022 saw a noticeable increase in the share of ratified union contracts involving arbitration. In 2022 in particular, employers appear to have been less willing to bargain contracts at the table; consequently, unions had to either rely on outside intervention to secure a new contract or go on strike, which many more did. So far this year, the data suggest that deals are being reached at the bargaining table much more frequently — with some additional assistance through conciliation.
What conclusions can be drawn from the available data? First, the evidence for a widespread “strike wave” is thin at best. There is undoubtedly a renewed interest in unionization, and it’s a welcome change that some in the mainstream media have picked up on this. But, at this point, a surge in worker militancy is mostly still political aspiration.
Second, it might be more accurate to characterize the post-pandemic years as a time of labour “outbursts.” Rather than a sustained wave of strikes or union militancy, what we have witnessed are relatively short and contained bursts of worker activity. In this vein, 2020 and 2022 exemplify this tendency. The former, mostly a pre-pandemic surge in activity among Ontario teachers in response to a particularly egregious piece of wage restraint legislation; the latter made up largely of uncoordinated attempts by unions to address an inflationary crisis that had been ravaging their members’ real wages.
At the same time, the data reviewed here could also be read as evincing a less-remarked upon but equally noteworthy employer pushback. An increase in person-days lost to strikes — but more importantly, growth in the share of union contracts arrived at through arbitration — point to employers resisting union demands across the bargaining table and as workers march outside of the factory gates.
Periods of economic uncertainty — as the post-pandemic years have been — are often characterized by class struggle. Although we might prefer this to mean simply a growth in workers asserting their demands, we need also to recognize that class struggle is a two-way street.
Recent Class Struggle Issues
- August 8 | UPS Workers And The Teamsters Have Achieved A Stunning Victory
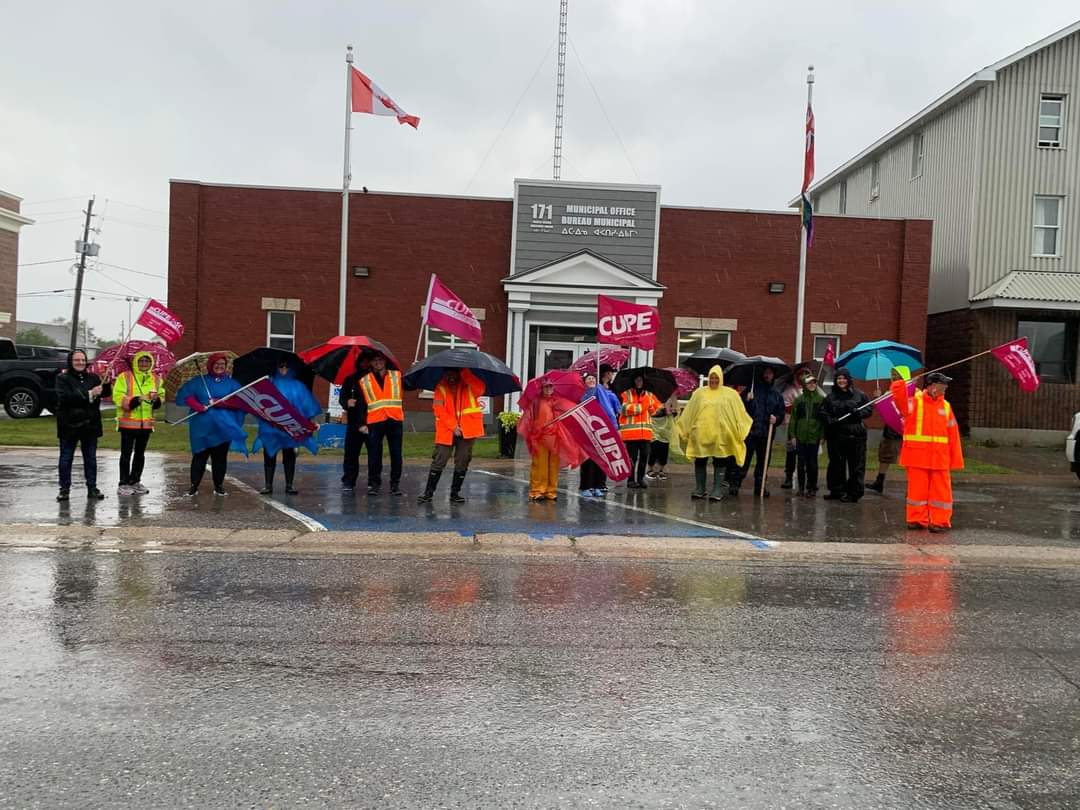
- August 1 | Iqaluit Workers In The Midst Of One Of Canada’s Longest Strikes
- July 24 | Board’s Ruling Against Port Workers A Blow To Labour Rights
- July 17 | The Tide May Be Turning For Organized Labour In Canada