
Yesterday, I published the latest version of The Maple’s annual database of elected officials at the provincial level who are landlords and/or invested in real estate.
These annual releases are only possible because all provinces require their elected officials to fill out disclosure forms containing, in part, property they own, sources of income and investments, which are then made public.
With that said, some provinces have far better disclosure report systems than others. After spending hours browsing through each province’s system annually, I’m well positioned to rank them, which I’m going to do here.
This may sound dry or unnecessary, but it’s actually important.
The public in each province and territory deserves to know what their elected officials are up to. The governments in the provinces seem to agree in theory, given they require disclosure reports be made public. However, some systems are set up so poorly that the province only barely meets this requirement in a practical sense, while others seem to be designed with the public in mind. In short, the quality of these systems is the difference between actual transparency and transparency in name only.
With that in mind, I’ve ranked all provinces and territories’ disclosure systems, from S to F tier, based on the following: 1) are they available to the public; 2) are they available online; 3) is there a page for each official; 4) is the page linkable; 5) are the reports typed; 6) are they searchable; 7) are past reports available?
Here’s a chart of how I ranked them. I break down why for each tier below, starting from worst to best.
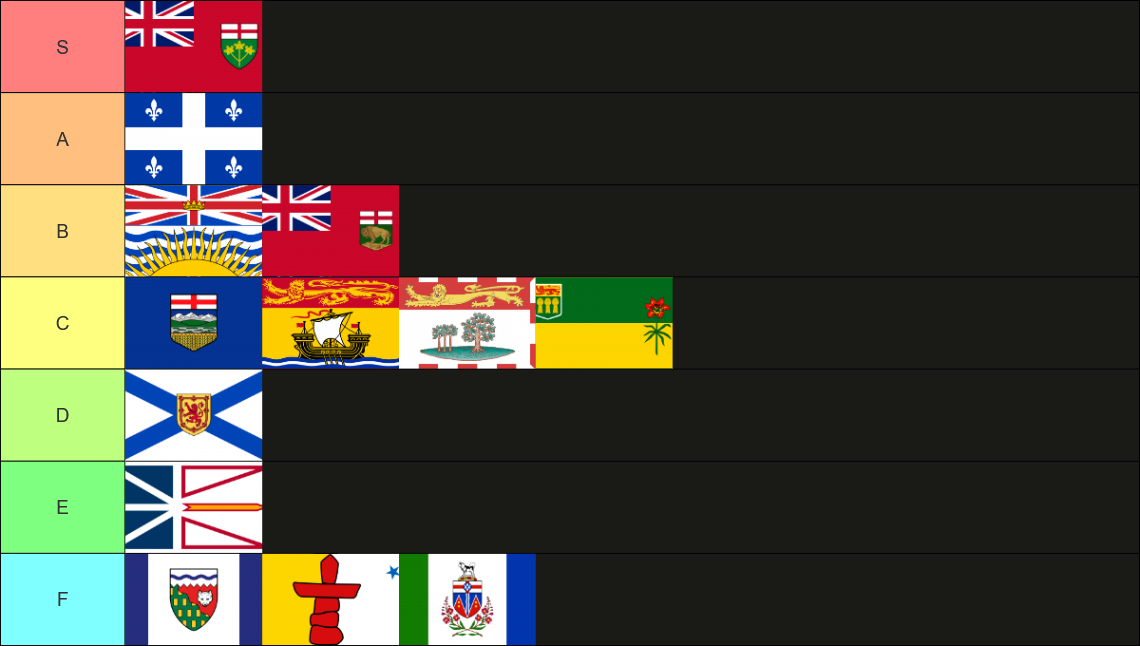
F Tier: Northwest Territories, Nunavut, Yukon
None of the territories make elected officials’ disclosure reports available to the public, automatically putting them at the bottom of my ranking. I reached out to the relevant official in each territory to ask why that’s the case, if they plan on changing it any time soon and if they’d be willing to send me the information, but none of them replied.
E Tier: Newfoundland and Labrador
Newfoundland and Labrador has a bizarre, archaic system. These reports are not available online at all, and the only way to actually see them in full is to visit an office in the province during business hours. I was only able to put together an article for the province because the relevant official passed along some details from the reports to me. But they said they could only do so over the phone, not even over email.
There’s no good reason for this system to continue as is, and it only benefits elected officials who would prefer for the public not to know how and where they make their money.
D Tier: Nova Scotia
Nova Scotia’s reports are available to the public online, with a linkable report for each representative. However, the reports are handwritten for some inexplicable reason, meaning they aren’t searchable and in some cases even very legible.
In addition, only the most-recent reports for current elected officials are available, with older ones being removed from the site, and thus public view unless copies have been made by others elsewhere.
C Tier: Alberta, New Brunswick, Prince Edward Island, Saskatchewan
All of these provinces have better systems than Nova Scotia, given that the reports make use of modern technology and are typed. Beyond that, each province’s system is better than Nova Scotia in one of two other specific ways: having searchable reports or having at least some past reports online.
New Brunswick and Saskatchewan have typed reports, but rather than uploading filled-out PDFs directly to the website, scans were made of printed copies and then uploaded, meaning they aren’t searchable. New Brunswick and Saskatchewan also beat out Nova Scotia by having reports starting in 2016 and 2021 available online, respectively.
Meanwhile, Alberta and Prince Edward Island both have typed, searchable reports, but neither makes past reports available online.
As such, I believe each province’s system is insufficient in its own unique way, though still better than Nova Scotia.
B Tier: British Columbia, Manitoba
This is where we start getting into systems that are actually usable.
Both British Columbia and Manitoba have online reports for each elected official that are typed, searchable, and linkable, hitting all of the formatting requirements. They also make past reports available online, though going back just one parliament for B.C. and to 2024 for Manitoba.
I should note here that the last time I put this database together, Manitoba did not make its reports available online, or perhaps at all. As such, it would have been rated either F or E, making its inclusion here a massive step forward.
A Tier: Quebec
Quebec has online reports for each elected official that are typed, searchable and linkable, hitting all of the formatting requirements. The province also appears to make every report a serving MNA has submitted since the system was introduced available, with some going as far back as 2011.
What prevents Quebec from being S tier, however, is that no reports are available online for former MNAs. I believe the public should have access to all of them, no matter when the MNA served.
S Tier: Ontario
Ontario’s system should serve as a model for all other provinces and territories.
Each report is typed and searchable, as you’d expect from a proper system. In addition, each report is presented as plain text rather than a PDF that needs to be opened separately or even downloaded. This makes it much easier to navigate the various reports, plus it ensures they only have relevant information.
In comparison, other provinces required me to open dozens of PDFs, and then scan through several often-empty pages for each one, sometimes reaching dozens of pages. By presenting just what is needed in plain text, analyzing Ontario’s reports took a fraction of the time of other provinces even though it has more elected officials than them.
In addition, Ontario makes annual reports available from 2005 (when the system was introduced) onward for any MPP who has ever been elected, meaning none of the information is ever removed. This is genuine transparency.
The only place for improvement in Ontario’s system is adding an option to share the report for a specific MPP from a specific year as a hyperlink so that the public doesn’t need to find them manually, though doing so is not very difficult given how the system is designed.
In March 2021, The Maple became the first publication to make the housing investments of elected officials across the country more accessible to the public. We’ve been examining and analyzing the data on an annual basis since then, and publishing it for all to see, with no paywalls.
As a 100 per cent reader-funded publication, this has only been possible due to readers like you. If you’d like to see this project continue, consider becoming a member and/or making a one-time donation. As a non-profit, every dollar you send will be invested into our journalism.